
Unhappiness.
"Action may not always bring happiness, but there is no happiness without action."- William James.


“Happiness is when what we think, say, and do are in harmony. ”
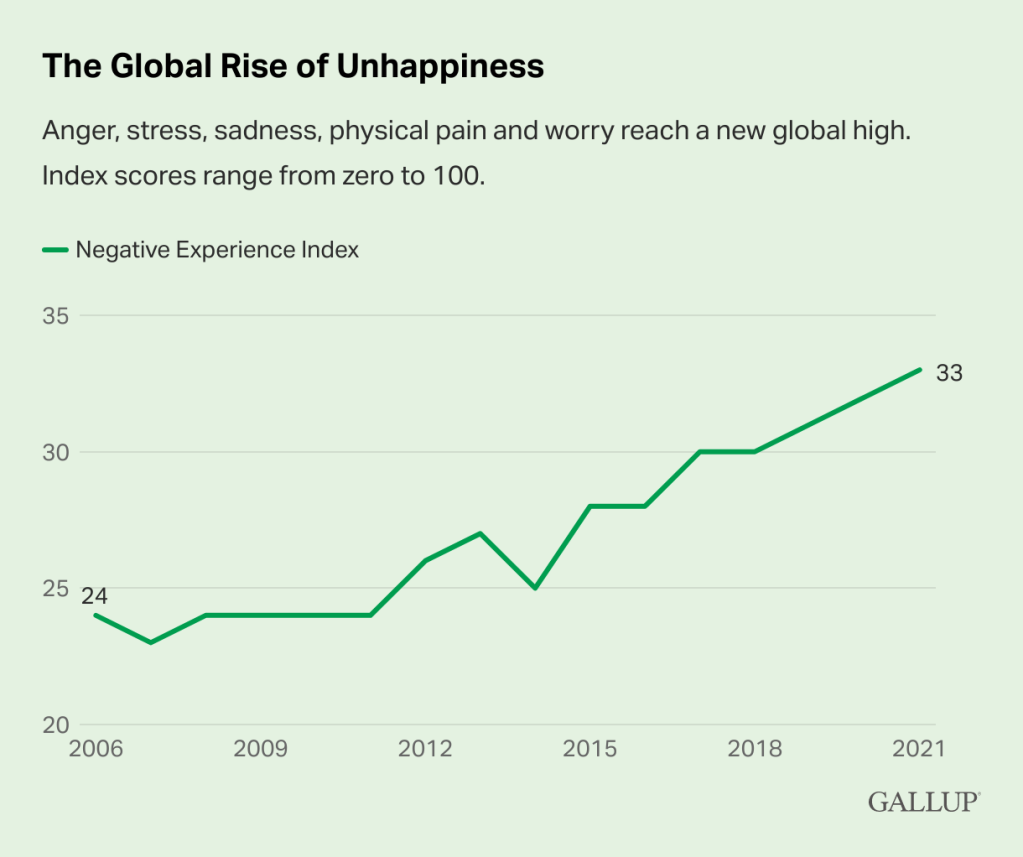
According to Gallup, people feel more anger, sadness, pain, worry, and stress than ever. The graphic below depicts the global rise of unhappiness. “Unhappiness has been rising worldwide for a decade, but almost every world leader missed it. Why? Because they were focused on measures like GDP and unemployment. Almost none of them were paying attention to how people were feeling,” according to Gallup.
In 2006, Gallup began conducting global research on subjective well-being, which is used interchangeably with “happiness.” The study’s goal was to definitively report — by country — how people’s lives were going from their perspective.
Thousands of interviewers have now sat with people in their homes or called them and asked them about their lives. This work now represents more than 98% of the world’s population and includes over 5 million interviews.
It is remarkable how open people are about sharing their sadness, their pain, or their anger. But it also concerns that many more people share these negative emotions with us.
When Gallup first asked the world this question in 2006, 3.4% of people told the pollsters their lives were a 10 — the best possible life. And only 1.6% said their lives were a zero — the worst possible life.
After 15 years of tracking, those numbers have shifted significantly. The number of people living their best lives has more than doubled (to 7.4%), while the number of people living their worst lives has more than quadrupled (to 7.6%).
But it gets worse.
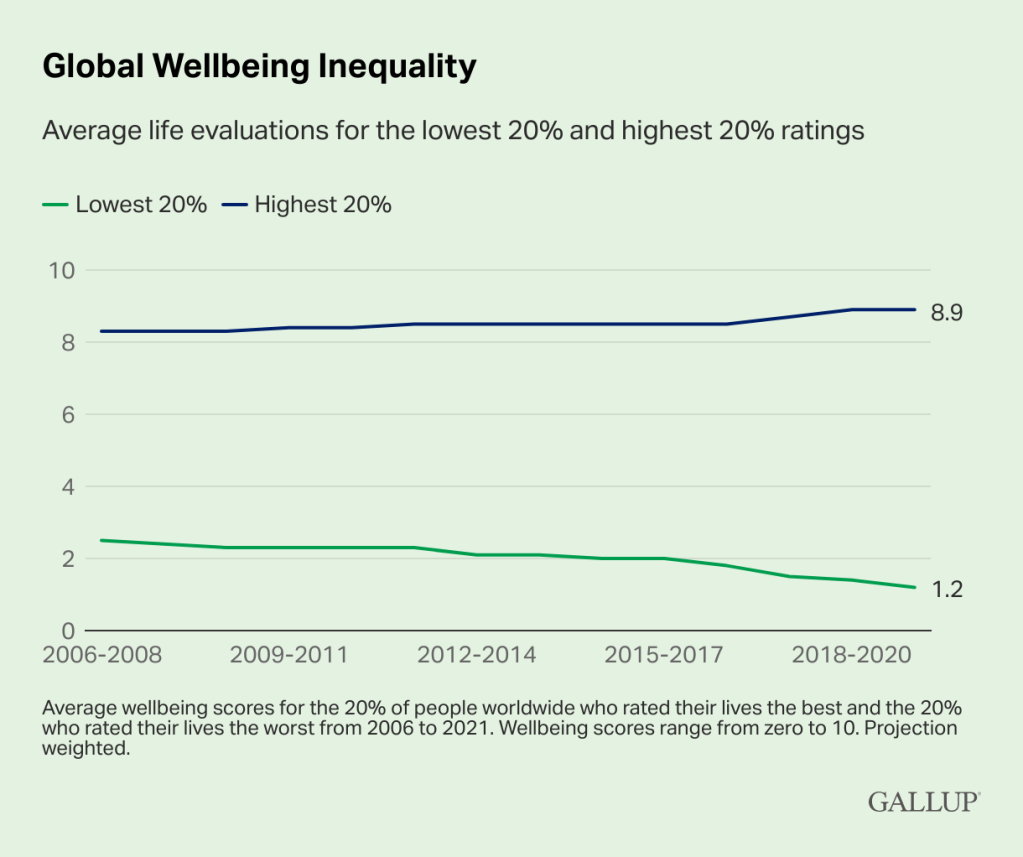
If you isolate the 20% of people globally who rate their lives the best and compare them with the 20% who place their lives the worst, you find just how unequal the world is becoming in terms of well-being and happiness.
In 2006, the 20% of the world who rated their lives the best had an average life rating of 8.3. The 20% who rated their lives the worst had an average life rating of 2.5.
Now, look at 2021. The 20% who rated their lives the best had an average life rating of 8.9, and the 20% who rated their lives the worst had an average life rating of 1.2. The gap in those life ratings is now 7.7 points — the highest in the history of Gallup’s tracking. The top 20% of the world could hardly be doing better, and the bottom 20% could hardly be doing worse.
You might think that income inequality explains well-being inequality and, therefore, rising unhappiness. That is certainly part of it. But a great life is more than just money. After studying the 20% of people who report having a great life, Gallup finds they have five things in common: They are fulfilled by their work, have little financial stress, live in great communities, have good physical health, and have a loving support system.
The 20% of people who rate their lives the worst have very little of any of those things. They don’t have quality jobs, their income is insufficient to get by, they live in broken communities, are hungry or malnourished, and have no support system. And the 20% who rate their lives this low are getting sadder, more stressed, and angrier than ever before.
Now that we laid out the case for measuring unhappiness let’s unpack the soft science behind the numbers. The “negative experience index” measures respondents’ experienced well-being on the day before the survey regarding physical pain, worry, sadness, stress, and depression. (1) The data depending our respondent's self-reporting.
Self-reports are subject to these biases and limitations:
- Honesty: Subjects may make the more socially acceptable answer rather than being truthful.
- Introspective ability: The subjects may not be able to assess themselves accurately.
- Interpretation of questions: The wording of the questions may be confusing or have different meanings to different subjects.
- Rating scales: Rating something yes or no can be too restrictive, but numerical scales also can be inexact and subject to individual inclination to give an extreme or middle response to all questions.
- Response bias: Questions are subject to all of the biases of what the previous responses were, whether they relate to recent or significant experience, and other factors.
- Sampling bias: The people who complete the questionnaire are the sort of people who will complete a questionnaire. Are they representative of the population you wish to study?
Also, the baseline of a sample population is relative to what? See the chart below of the percentage of the world’s population living in extreme poverty has dramatically dropped over the last 65 years. And, yet, we are more unhappy than ever? Or does the media present a utopian idea of success in which the majority of the world’s population suffers by comparison? There are several psychological biases that suggest envy, not unhappiness, is working to skew the data.

In the graphic below, let me present a slightly different view of the recent world from my friends at Oxford. Has a slight US happiness declined over the last 21 years? Yes. The United Kingdom and Sweden both appear stable. Russia is the big winner over that time period, to no one surprise. Coming out of the Soviet Union’s communist grasp felt very liberating to the average Russian.

My point is simple. I don’t doubt my learned and very honest friends at Gallup's ability to conduct a study. But let’s be careful that our slice of the data is robust and not subject to musing of the moment or excessive hyperbole.
Let’s look at the lead sentence of the story again. According to Gallup, people feel more anger, sadness, pain, worry, and stress than ever. As a long-time social scientist, the “than ever” part gets me scratching my head.
End Notes